用cocoapods集成Charts说多了都是泪,全是坑!不过全都搞好以后,画图表还是很方便的。
然后再clean,居然好了。。。
Charts 是何方神圣 Charts是一套非常漂亮的开源图表组件,它是MPAndroidChart 在苹果端的移植版本,同时支持iOS/tvOS/OSX平台,开源地址Github 。
同时,Charts是用 Swift 语言编写的,能够在 Swift 和 Objc 工程中使用。
使用环境
Xcode 8.0 / Swift 3.0 (如果要支持 Swift 2.3 ,请查看 Charts 2.3 )
iOS >= 8.0
tvOS >= 9.0
macOS >= 10.11
使用方法 本文使用的是通过cocopods 来安装的,中间的过程有点曲折
通过 cocoapods 集成 如果项目还未使用cocoapods,可用终端在根目录下输入
然后在项目的 Podfile 文件中添加 Charts
如果不出意外的话,会在安装过程中报个小错
1
[!] Pods written in Swift can only be integrated as frameworks; add `use_frameworks!` to your Podfile or target to opt into using it. The Swift Pod being used is : Charts
恭喜踩到了第一个坑
为什么呢 原来根据苹果的相关政策,在 Swift项目中苹果将不允许你私自包含静态库了,因此我们的解决办法是,在 podfile 文件中 添加这么一句1
2
pod 'Charts' , '~> 3.0'
use_frameworks!
use_frameworks!选项是告诉 CocoaPods 使用 framework 而不是静态库。这在 Swift 项目中是必选。
完成之后,我们开始导入
导入库 在项目的根目录下,输入
静待几分钟后,会有提示倒入成功注意哦,是 xcworkspace 不再是原来的 xcodeproj文件了
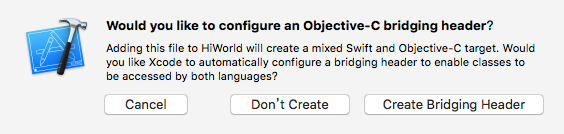
因为我们的项目是 OC 的,而 Charts 是用 Swift 编写的,所以需要创建一个桥接文件
执行完这一步后,如果有报错之类的,可以先把项目 clean 一下 敲黑板 这是一道送分题,千万不能忘
接着在桥接文件 项目名-Bridging-Header.h 中,写上要引用的 Swift 头文件。
大功告成 进入测试阶段 在ViewController.m中加入如下代码:1
2
3
4
5
6
7
8
9
10
11
12
13
14
15
16
17
18
19
20
21
22
23
24
25
26
27
28
29
30
31
32
33
34
35
36
37
38
39
40
- (void )viewDidLoad {
[super viewDidLoad];
self .view.backgroundColor = [UIColor colorWithRed:0.184 green:1.000 blue:0.738 alpha:1.000 ];
lineView = [[LineChartView alloc]initWithFrame:CGRectMake (0 , self .view.bounds.size.height / 3.0 f,[UIScreen mainScreen].bounds.size.width, [UIScreen mainScreen].bounds.size.height / 3.0 )];
lineView.backgroundColor = [UIColor colorWithRed:0.184 green:1.000 blue:0.738 alpha:1.000 ];
[self .view addSubview:lineView];
lineView.dragEnabled = YES ;
lineView.drawGridBackgroundEnabled = NO ;
lineView.scaleXEnabled = NO ;
lineView.pinchZoomEnabled = NO ;
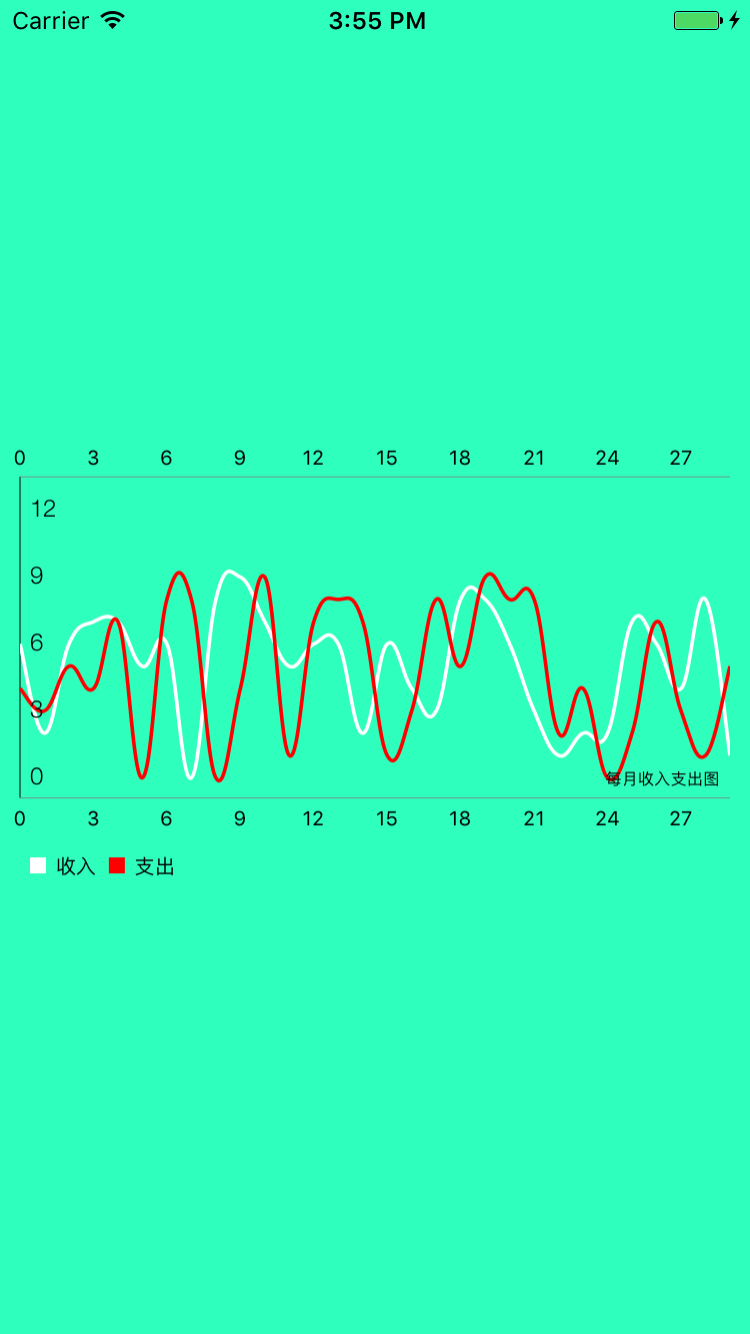
lineView.descriptionText = @"每月收入支出图" ;
ChartXAxis *xAxis = lineView.xAxis;
xAxis.labelPosition = XAxisLabelPositionBothSided;
xAxis.drawLabelsEnabled = YES ;
xAxis.drawAxisLineEnabled = YES ;
xAxis.drawGridLinesEnabled = NO ;
xAxis.axisLineWidth = 0.4 f;
[xAxis setLabelCount:10 force:NO ];
ChartYAxis *yAxis = lineView.leftAxis;
yAxis.spaceTop = .5 f;
yAxis.labelFont = [UIFont fontWithName:@"HelveticaNeue-Light" size:12. f];
[yAxis setLabelCount:5 force:NO ];
yAxis.labelTextColor = [UIColor blackColor];
yAxis.labelPosition = YAxisLabelPositionInsideChart;
yAxis.drawGridLinesEnabled = NO ;
yAxis.axisLineColor = UIColor .blackColor;
lineView.rightAxis.enabled = NO ;
int count = 30 ;
double range = 10 ;
[self setDataCount:count range:range];
[lineView animateWithXAxisDuration:3 yAxisDuration:3 ];
}
然后随机配置一下数据,就能看到两条曲线了ChartsDemo
参考博客 Cocoapods 安装参考 Swift静态库参考